
⚡ Quick Answer — Fundamental Analysis क्या है?
Fundamental Analysis = किसी company की actual business strength देखकर उसके stock की real value calculate करने की method।
यह answer करती है: “क्या यह company financially strong है? और क्या इसका stock सही price पर है?”
Stock Market में पैसा बनाने के दो main approaches हैं:
- Fundamental Analysis — Company का business, financials, और value देखना
- Technical Analysis — Charts और price patterns देखना
Long-term investors के लिए Fundamental Analysis सबसे important skill है। Warren Buffett, Rakesh Jhunjhunwala — दुनिया के सबसे successful investors fundamentals पर invest करते हैं।
लेकिन problem है — ज़्यादातर Fundamental Analysis guides English में हैं, complicated terms से भरी हैं — P/E ratio, EPS, RoE, D/E, EBITDA — beginners को समझ नहीं आता।
इस article में हम हर term को आसान हिंदी में real examples के साथ समझेंगे। Article पढ़ने के बाद आप किसी भी company का basic fundamental analysis खुद कर पाएंगे।
पहले पढ़ें: Stock कैसे चुनें? 5-Step Method — यह article उसी का deeper extension है।
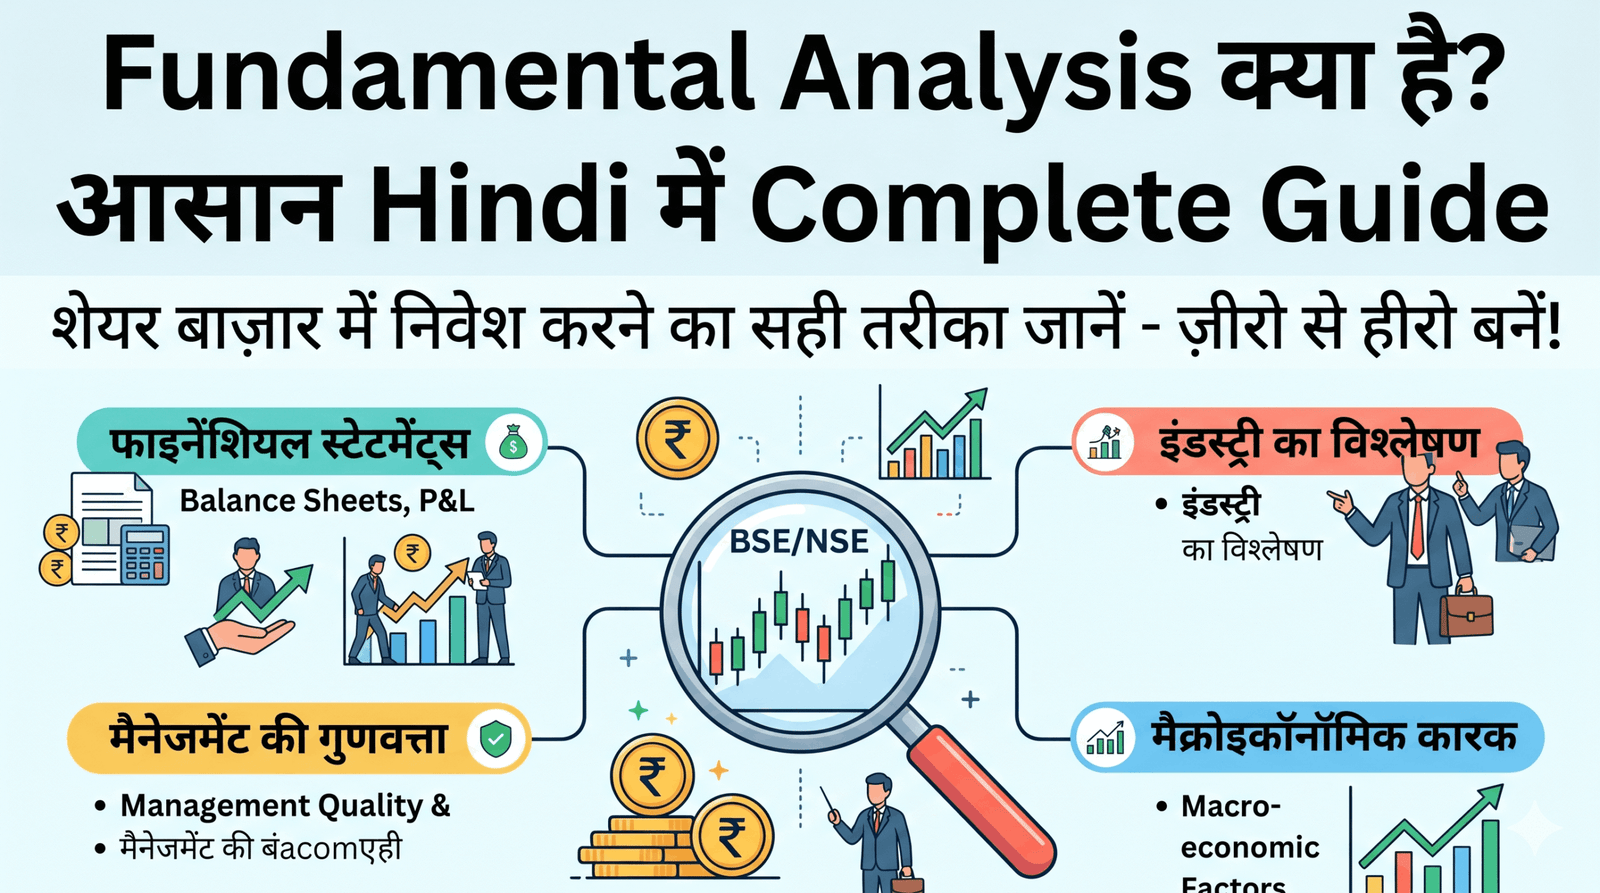
🏗️ Fundamental Analysis क्या है? — Simple Definition
Imagine करिए आप एक दुकान खरीदना चाहते हैं। आप क्या देखेंगे?
- 💰 दुकान कितना कमाती है?
- 📦 माल कितना बिकता है?
- 🏦 कर्ज़ कितना है?
- 🏪 Location अच्छी है?
- 👨💼 मालिक reliable है?
यही process Stock Market में किसी company के shares खरीदने पर apply होती है — इसे Fundamental Analysis कहते हैं।
💡 Simple definition: Fundamental Analysis = कंपनी की financial health, business quality, और future growth potential को numbers और facts से measure करना — ताकि पता चले कि stock actually कितने का होना चाहिए।
Fundamental vs Technical Analysis
| Factor | Fundamental Analysis | Technical Analysis |
|---|---|---|
| क्या देखता है | Business + Financials + Value | Price charts + patterns + indicators |
| Time horizon | Long-term (months to years) | Short to medium term |
| Question | “क्या यह company अच्छी है?” | “क्या अभी खरीदना सही time है?” |
| Best for | Long-term investors | Traders |
| Data source | Financial statements, annual reports | Price and volume data |
Long-term investors के लिए: Fundamental Analysis पहले, Technical Analysis optional।
📑 Financial Statements — Data कहाँ से आता है?
Fundamental Analysis के लिए data आता है company के 3 main financial statements से:
Statement 1: Income Statement (P&L Statement)
“Company ने कितना कमाया और कितना बचाया?”
| Line Item | क्या है | Example (TCS FY24) |
|---|---|---|
| Revenue / Sales | Total sales/service income | ₹2,40,893 cr |
| Cost of Revenue | Sales generate करने की direct cost | ₹1,44,536 cr |
| Gross Profit | Revenue – Direct costs | ₹96,357 cr |
| Operating Expenses | Admin, marketing, overhead | ₹24,000 cr |
| EBITDA | Earnings before interest, tax, depreciation | ₹72,000 cr |
| Net Profit (PAT) | सब काटने के बाद बचा profit | ₹46,099 cr |
Statement 2: Balance Sheet
“Company के पास क्या है और किसका कितना है?”
- Assets — Cash, property, equipment, inventory जो company के पास है
- Liabilities — Loans, bills payable, जो company को देना है
- Equity (Net Worth) — Assets – Liabilities = Shareholders का हिस्सा
Statement 3: Cash Flow Statement
“Company का actual cash कहाँ से आया और कहाँ गया?”
यह सबसे honest statement है — profit को manipulate किया जा सकता है, लेकिन cash flow को नहीं।
- Operating Cash Flow — Core business से cash
- Investing Cash Flow — Assets buy/sell
- Financing Cash Flow — Loans, dividends
✅ Healthy sign: Operating Cash Flow consistently positive और growing — company actually cash बना रही है।
⚠️ Red flag: Profit है लेकिन Operating Cash Flow negative — कुछ गड़बड़ है।
यह data कहाँ मिलेगा? Screener.in पर company search करें → Financials tab → सब तीनों statements मिलेंगे, 10 साल का data।
📊 Key Ratios — Fundamental Analysis के 8 Most Important Numbers
Financial statements बड़े होते हैं — हर number नहीं देखना। यह 8 key ratios सबसे important हैं:
Ratio 1: EPS — Earnings Per Share
Formula: Net Profit ÷ Total Shares Outstanding
हिंदी में: Company ने जो profit कमाया — उसे सब shares में बाँटो। हर share पर कितना profit आया?
Example: TCS का Net Profit ₹46,099 cr। Total shares 3.65 cr। EPS = ₹46,099 ÷ 3.65 = ₹126.3 per share।
क्यों important:
- ✅ EPS growing = company per share ज़्यादा कमा रही है = good
- ❌ EPS flat या declining = growth रुकी है
- 📌 Bonus/split के बाद EPS adjust होता है — historical comparison के लिए adjusted EPS use करें
Ratio 2: P/E Ratio — Price to Earnings
Formula: Current Stock Price ÷ EPS
हिंदी में: Investors इस company की ₹1 की earning के लिए कितना pay कर रहे हैं?
Example: TCS price ₹4,200। EPS ₹126.3। P/E = ₹4,200 ÷ ₹126.3 = 33x।
Interpretation:
| P/E Range | General Interpretation |
|---|---|
| Below 10x | Very cheap — investigate why (could be value trap) |
| 10x – 20x | Reasonable — good for mature companies |
| 20x – 35x | Growth premium — acceptable for quality |
| 35x – 60x | Expensive — strong growth must justify this |
| 60x+ | Very expensive — be careful |
⚠️ Always compare P/E within the same sector — FMCG companies normally trade at 50x+ P/E जो IT sector के 25x से बहुत अलग है।
Ratio 3: P/B Ratio — Price to Book Value
Formula: Stock Price ÷ Book Value per Share
Book Value क्या है: अगर company आज बंद हो जाए, सब assets बेचे, सब debts चुकाए — shareholders को per share कितना मिलेगा। यह company की “accounting value” है।
Interpretation:
- P/B < 1: Stock book value से कम trade हो रहा है — potentially undervalued (या company में serious problems)
- P/B 1-3: Normal range
- P/B 3+: Premium — justified only for high-RoE companies
Best used for: Banks, NBFCs, और asset-heavy companies।
Ratio 4: RoE — Return on Equity
Formula: Net Profit ÷ Shareholders’ Equity × 100
हिंदी में: Shareholders ने जो पैसा company में लगाया है — उस पर company कितना % return बना रही है?
Example: TCS RoE ~50%। मतलब — shareholders के हर ₹100 investment पर TCS ₹50 profit बनाती है। यह exceptional है।
| RoE Level | Signal |
|---|---|
| Below 10% | ❌ Poor — बेहतर options हैं |
| 10% – 15% | ⚠️ Average |
| 15% – 20% | ✅ Good |
| 20% – 30% | ✅ Very Good |
| 30%+ | ✅ Exceptional — rare, quality company |
Key rule: RoE consistently 15%+ होना चाहिए — 5-10 साल तक। One-year high RoE misleading हो सकता है।
Ratio 5: RoCE — Return on Capital Employed
Formula: EBIT ÷ Capital Employed × 100
RoE vs RoCE फर्क:
- RoE = Equity पर return (shareholders का पैसा)
- RoCE = Total capital पर return (equity + debt दोनों)
RoCE debt को include करता है — इसलिए यह ज़्यादा complete picture देता है। High debt companies में RoE artificially high दिख सकता है — RoCE honest होता है।
Good RoCE: 15%+ consistently।
Ratio 6: Debt-to-Equity Ratio (D/E)
Formula: Total Debt ÷ Total Equity
इसे हमने Post #18 में detail में cover किया है। Quick recap:
- ✅ D/E below 0.5 — excellent
- ✅ D/E 0.5-1.0 — acceptable
- ⚠️ D/E 1.0-2.0 — watch करें
- ❌ D/E 2.0+ — risky (except infrastructure/real estate)
Ratio 7: Current Ratio
Formula: Current Assets ÷ Current Liabilities
हिंदी में: Company अगले 12 महीनों में जो bills/debts देने हैं — उन्हें pay करने की capacity कितनी है?
- Current Ratio < 1: ❌ Company short-term obligations meet नहीं कर पाएगी — liquidity crisis risk
- Current Ratio 1-2: ✅ Comfortable
- Current Ratio 2+: ✅ Very safe (लेकिन बहुत high means idle cash)
Ratio 8: Dividend Yield
Formula: Annual Dividend per Share ÷ Stock Price × 100
Example: Coal India annual dividend ₹25। Stock price ₹490। Dividend Yield = (25÷490) × 100 = 5.1%।
| Dividend Yield | Interpretation |
|---|---|
| 0% – 1% | Growth company — reinvesting profits |
| 1% – 3% | Moderate — balanced approach |
| 3% – 6% | Good income stock |
| 6%+ | High yield — verify sustainability |
Watch out: Unsustainably high dividend yield (8%+) sometimes signal करता है कि stock price गिर रही है या dividend cut आने वाला है।
🔢 Ratios एक साथ — Complete Example: ITC Analysis
अब एक real company पर सब ratios एक साथ apply करते हैं — ITC Limited।
| Ratio | ITC Value (Approx FY24) | Assessment |
|---|---|---|
| EPS | ₹15.8/share | ✅ Growing consistently |
| P/E Ratio | ~28x | ✅ Reasonable for FMCG |
| P/B Ratio | ~7x | ⚠️ Premium — brand justified |
| RoE | ~30% | ✅ Exceptional |
| RoCE | ~39% | ✅ Excellent |
| D/E Ratio | ~0 (Debt-free) | ✅ Perfect |
| Current Ratio | ~1.8 | ✅ Comfortable |
| Dividend Yield | ~3.4% | ✅ Good passive income |
ITC Fundamental Score: 7.5/8 ✅
Debt-free, high RoE, consistent dividend, reasonable valuation — ITC fundamentally very strong company है। यही reason है कि यह beginners के लिए popular choice है।
📈 Qualitative Factors — Numbers से परे
Fundamental Analysis सिर्फ numbers नहीं है — कुछ important factors qualitative होते हैं जो directly numbers में नहीं दिखते।
1. Industry Tailwinds
Company जिस industry में है — वो industry grow कर रही है या shrink हो रही है?
- ✅ Growing industries: EV, renewable energy, digital payments, healthcare, data centers
- ⚠️ Declining industries: Print media, traditional tobacco (long-term), landline telecom
2. Competitive Positioning
Industry में company की position क्या है?
- Market leader — safest bet (Maruti in passenger cars, HUL in FMCG)
- Fast challenger — higher growth potential, more risk
- Niche player — focused, can be excellent if moat strong
3. Management Quality और Vision
Numbers पिछले performance दिखाते हैं — management future बनाता है। Annual report में Chairman’s Letter पढ़ें — vision clear है? Realistic targets हैं?
4. Regulatory Environment
Company का business किसी regulation change से severely affect हो सकता है?
- Banking — RBI regulations
- Pharma — USFDA approvals/warnings
- Tobacco — Taxation policy changes
- Fintech — Digital lending guidelines
5. Promoter Actions — “Skin in the Game”
Promoters खुद क्या कर रहे हैं?
- ✅ Promoters shares खरीद रहे हैं — confidence signal
- ✅ Dividend बढ़ रही है — company healthy है
- ❌ Promoters heavily selling — exit ले रहे हैं?
- ❌ High pledging — financial stress
🎯 Intrinsic Value — Stock की “Real Value” कैसे निकालें
Fundamental Analysis का ultimate goal है — stock की Intrinsic Value पता करना। यानी “यह stock actually कितने का होना चाहिए?”
Simple Method: Earnings-Based Valuation
Beginners के लिए easiest method:
Fair Value = EPS × Appropriate P/E for sector
Example — ITC:
- EPS: ₹15.8
- FMCG sector average P/E: ~35x
- Fair Value estimate: ₹15.8 × 35 = ₹553/share
- Current Price: ~₹450
- Conclusion: Stock possibly undervalued by ~18% ✅
⚠️ Important disclaimer: यह simple estimate है — actual valuation बहुत complex होती है। Professional analysts DCF (Discounted Cash Flow) models use करते हैं। Beginners के लिए यह rough check enough है।
Margin of Safety
Benjamin Graham (Warren Buffett के guru) का concept:
“Always buy with a margin of safety — intrinsic value से 20-30% कम पर।”
अगर Fair Value ₹553 है → ₹553 × 0.75 = ₹415 पर buy करना ideal। यह buffer protect करता है अगर आपकी calculation थोड़ी गलत हो।
🛠️ Fundamental Analysis Step-by-Step: Practical Workflow
इस exact workflow को हर stock पर apply करें:
Step 1: Business Understanding (5 min)
- Company का business model क्या है?
- Revenue streams कितने हैं?
- क्या मैं clearly explain कर सकता हूँ?
Step 2: Financial Health Check (10 min — Screener.in)
- Revenue trend — 5-10 साल ✅/❌
- Net Profit trend ✅/❌
- Operating Cash Flow positive? ✅/❌
- D/E Ratio 1 से कम? ✅/❌
Step 3: Profitability Ratios (5 min)
- RoE 15%+? ✅/❌
- RoCE 15%+? ✅/❌
- Profit Margins expanding या stable? ✅/❌
Step 4: Valuation Check (5 min)
- P/E sector average में? ✅/❌
- PEG 1 से कम? ✅/❌
- Simple Fair Value calculation ✅/❌
Step 5: Management Check (5 min)
- Promoter holding 40%+? ✅/❌
- Pledging कम/zero? ✅/❌
- Recent insider buying/selling? ✅/❌
Step 6: Qualitative Factors (5 min)
- Industry growing? ✅/❌
- Moat/competitive advantage? ✅/❌
- No major regulatory risk? ✅/❌
Total time: 30-35 minutes per company। यह enough है एक informed investment decision के लिए।
⚠️ Common Fundamental Analysis Mistakes
Mistake 1: Sirf Ek Ratio देखना
Low P/E = cheap — यह sochna wrong है। Low P/E sometimes “value trap” होता है — company declining है इसलिए सस्ती है। Always multiple ratios together देखें।
Mistake 2: One Quarter Results पर React करना
एक bad quarter panic का reason नहीं है — one-time charges, seasonality, या external factors हो सकते हैं। कम से कम 4-8 quarters का trend देखें।
Mistake 3: Profit को Cash Flow मानना
Accounting profit और actual cash अलग हो सकते हैं। Company “profit” दिखा सकती है लेकिन cash नहीं बना रही हो। Always Operating Cash Flow check करें।
Mistake 4: Industry Context Ignore करना
Banking company का P/E 12 हो और IT company का P/E 28 हो — दोनों को same scale पर compare करना गलत है। हर sector का अपना normal range होता है।
Mistake 5: Future को Guarantee मानना
Past financial performance future guarantee नहीं है। Fundamental Analysis probability बढ़ाता है — certainty नहीं देता। इसीलिए diversification ज़रूरी है।
📊 Research किया — अब Invest करें
Fundamental Analysis सीख लिया। अब Zerodha Kite + Screener.in combo use करें — research और invest एक साथ।
- ✅ Zerodha Kite में fundamentals tab available
- ✅ ₹0 delivery brokerage — long-term investors के लिए
- ✅ Zerodha Varsity — free detailed fundamental analysis course
⚠️ Affiliate link — zero extra cost to you।
❓ FAQs — Fundamental Analysis के बारे में
Q1: Fundamental Analysis कितना time लेती है?
एक company की basic fundamental analysis: 30-45 minutes। Screener.in पर data 5 minutes में देख सकते हैं। Annual report पढ़ने में 1-2 घंटे लग सकते हैं — लेकिन शुरुआत में financial summary और key ratios enough हैं। जैसे-जैसे experience बढ़ता है, analysis faster होती है।
Q2: क्या Screener.in free है?
हाँ, Screener.in basic version completely free है। Company financials, ratios, 10-year data, shareholding pattern — सब free में available है। Premium version (paid) में custom screens और email alerts मिलते हैं — लेकिन beginners के लिए free version काफी है। Registration करें (free) → और ज़्यादा data access होगा।
Q3: P/E Ratio negative कब होता है? क्या यह bad है?
P/E ratio negative तब होता है जब company loss में होती है (negative EPS)। यह generally एक warning sign है। कुछ cases में startups या turnaround companies में यह temporary हो सकता है। Beginners के लिए: negative P/E वाली companies avoid करें — जब तक आप deeply उस business को नहीं समझते।
Q4: क्या Fundamental Analysis हमेशा सही होती है?
नहीं — कोई भी analysis 100% सही नहीं होती। Fundamental Analysis probability बढ़ाती है — guarantee नहीं देती। Strong fundamentals वाली company भी short-term में गिर सकती है। इसीलिए: (1) Diversification रखें, (2) Long-term mindset रखें, (3) एक company में 10-15% से ज़्यादा portfolio concentrate मत करें।
Q5: Technical Analysis vs Fundamental Analysis — दोनों साथ में सीखूँ?
Long-term investors के लिए: Fundamental Analysis पहले, Technical Analysis later। Priority: Fundamental (company क्या है) → तब Technical (कब खरीदें)। Many successful long-term investors technical analysis बिल्कुल नहीं use करते। But if you want — Fundamental Analysis से stock select करें, फिर Technical से entry point time करें।
🎯 Summary — आज से Apply करें
Fundamental Analysis का essence simple है:
- ✅ EPS — company per share कितना कमाती है?
- ✅ P/E Ratio — stock सस्ता है या महंगा?
- ✅ RoE और RoCE — capital efficiently use हो रहा है?
- ✅ D/E Ratio — debt manageable है?
- ✅ Cash Flow — actual cash बन रही है?
- ✅ Dividend Yield — passive income कितनी?
- ✅ Qualitative factors — industry, management, moat
आज का action:
- Screener.in पर free account बनाएं
- ITC search करें → सब 8 ratios check करें
- फिर TCS पर try करें → compare करें
- अगले हफ्ते: HDFC Bank और HUL analyze करें
हर company पर 30 minutes — 4 companies = 2 घंटे। यह 2 घंटे आपको लाखों रुपये बचा सकते हैं गलत investments से।
🎯 Final thought: Fundamental Analysis एक skill है — पहली बार overwhelming लगती है, लेकिन practice से आसान होती जाती है। जैसे driving सीखने पर gear, clutch, brake सब confusing लगता था — आज automatically होता है। शुरू करें, practice करें।
📧 Weekly Stock Analysis Tips — Hindi में Free
Fundamental analysis tips, stock ideas, IPO reviews — हर Sunday। 5,000+ investors subscribed।
Free Subscribe करें →📚 Related Posts — आगे क्या पढ़ें
- 👉 Post #18: Stock कैसे चुनें? 5-Step Beginner Method
- 👉 Post #17: Long-term vs Short-term Investing
- 👉 Post #20: Stock Market में सबसे बड़ी 10 गलतियाँ
- 👉 Post #22: Risk Management Complete Guide
- 👉 Post #30: Stock Market Glossary — 50 ज़रूरी Terms
- 👉 Post #68: Technical Analysis क्या है? Complete Guide

👤 Sarita Mishra
10+ साल का stock market investing experience। Founder of Stock Market Pro. Hindi में finance education के माध्यम से beginners को सही investment decisions लेने में मदद करना मेरा mission है।
📅 Published: [Date] · 🔄 Last Updated: [Date] · ⏱️ Reading time: 12 minutes
6 thoughts on “Fundamental Analysis क्या है? आसान Hindi में Complete Guide”