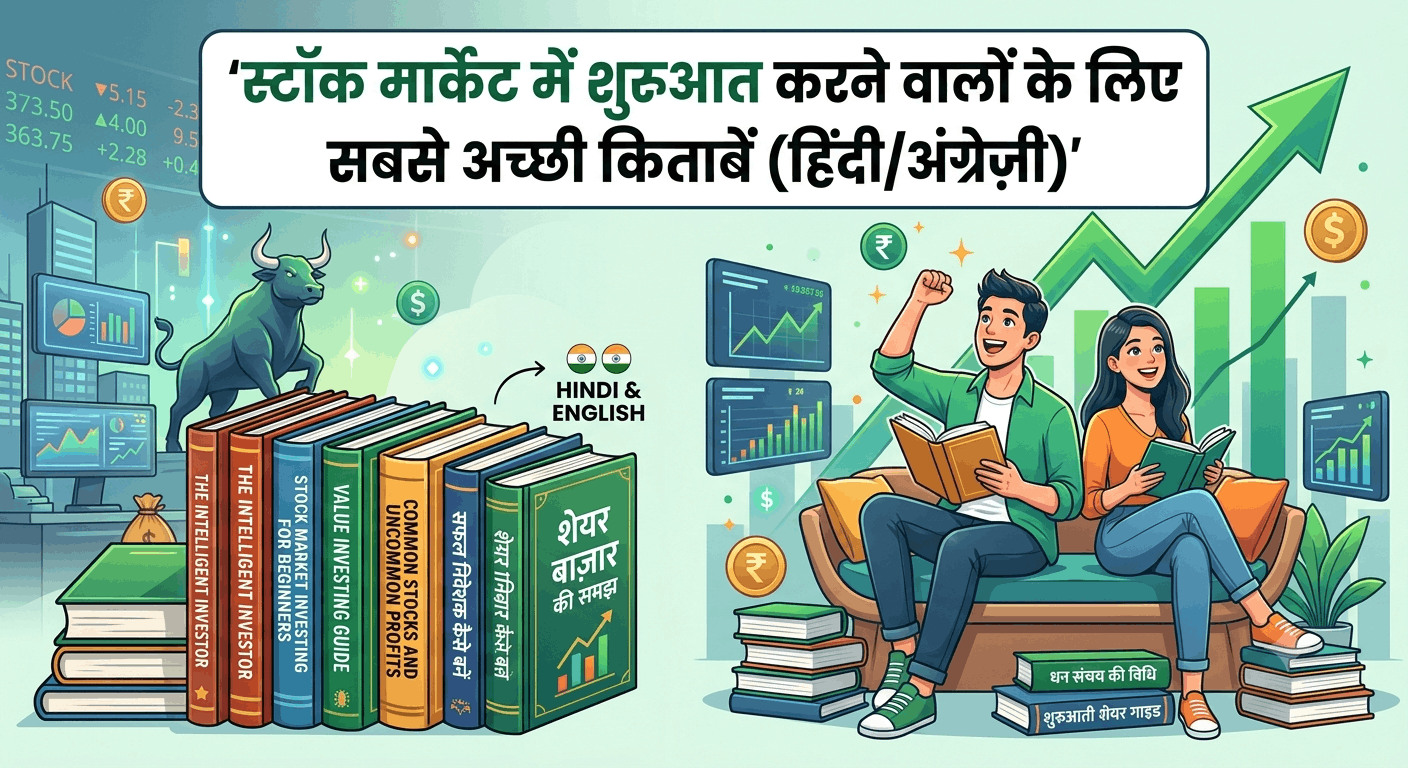
Financial Freedom की पूरी Guide — 25 से Retirement तक
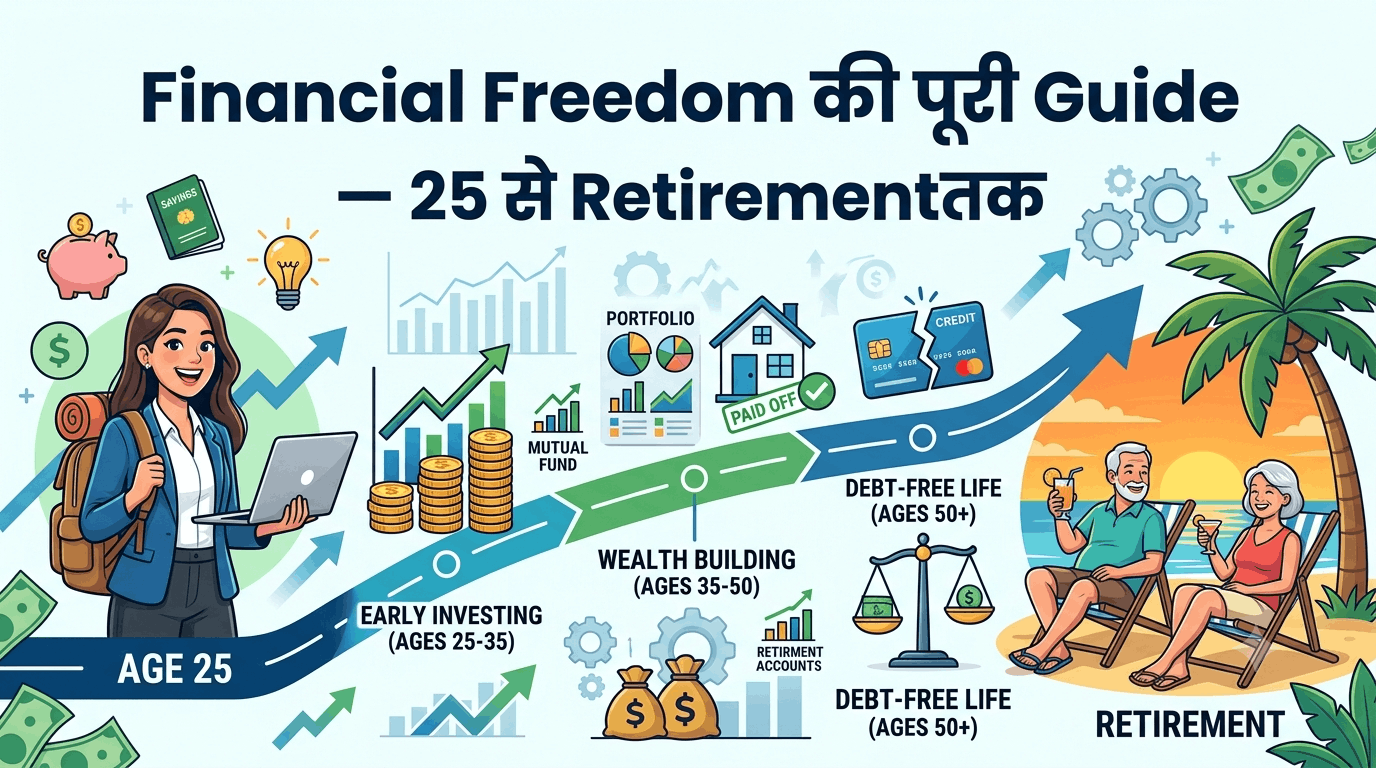
Financial Freedom का मतलब है — एक ऐसी स्थिति जहां काम करना ज़रूरी नहीं, विकल्प (choice) बन जाए। यह रातों-रात नहीं आती; यह दशकों की सही आदतों, सही insurance, aur consistent investing का नतीजा होती है। इस Financial Freedom Guide में मैं उम्र के हर पड़ाव — 25 साल से लेकर retirement तक — के … Read more